
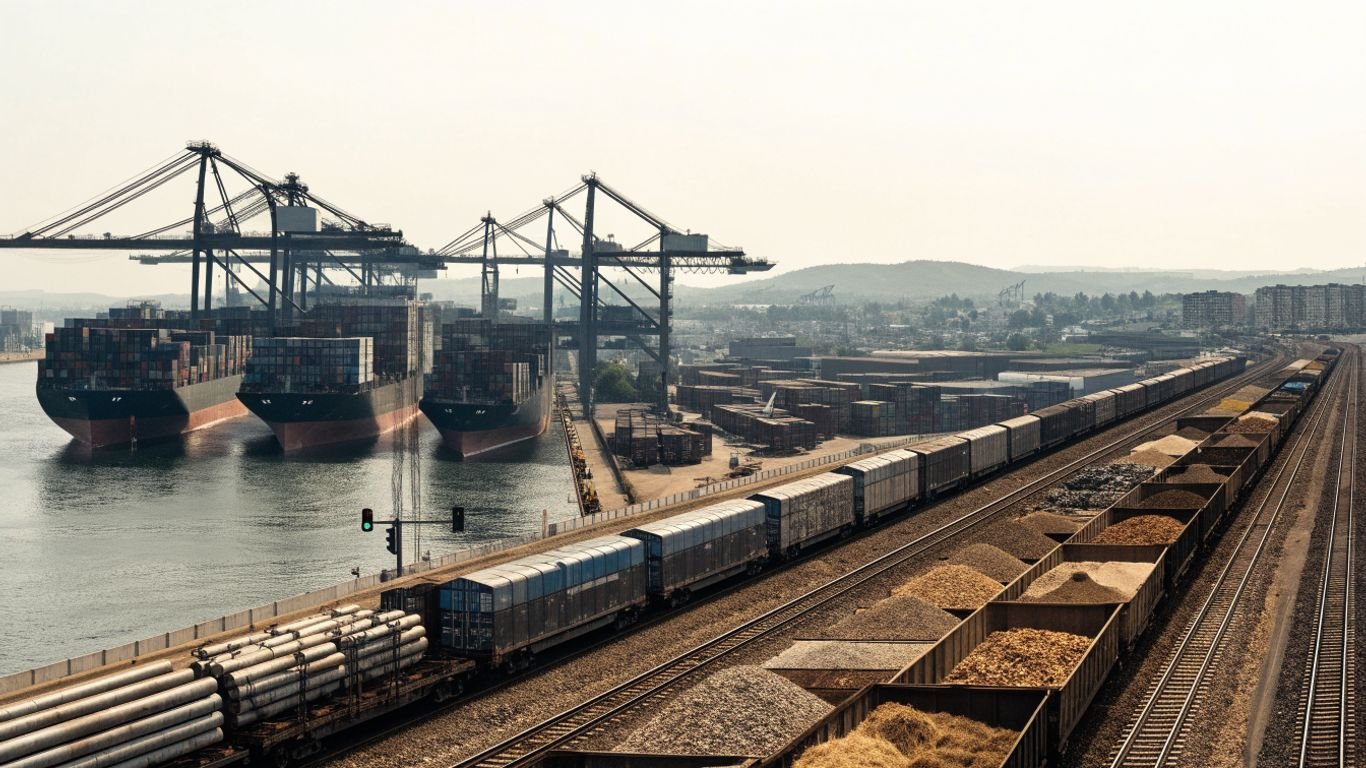
The Biggest Export of Every Country in the World
Key Takeaways
A country’s biggest export depends on how trade is measured, which products are grouped together, and what year the data covers. The comparisons below offer a regional guide to leading goods, not a single timeless ranking.
- Export rankings by value can differ from rankings by physical volume.
- Goods exports and services exports are separate measures and should not be casually combined.
- Energy, minerals, farm products, vehicles, electronics, and medicines recur among countries’ leading goods.
- A product that leads in one reporting year may not lead in another, especially when prices swing.
- Re-exports, broad product categories, and gaps in reporting can make country comparisons less straightforward.
How “biggest export” is defined
The phrase “biggest export by country” sounds like a simple label, but it depends on the measure behind it. A ranking might compare the value of goods, the amount shipped, or goods and services together. It also needs a year and a consistent way to group products. This guide focuses mainly on merchandise exports and uses examples to show common patterns, rather than treating every country’s ranking as fixed.
Comparing export value rather than volume
Export rankings usually compare the money earned from shipments, not their weight or number. A small quantity of a high-priced mineral or manufactured product may therefore outrank a much larger volume of a lower-priced commodity. That distinction matters when comparing a country that sells oil with one that exports grain or apparel. Value and volume tell different stories about a country’s trade.
A useful comparison should say what its numbers measure and identify the year. When examining a country’s position alongside larger trading economies, readers can also explore global trade powers for context on how exports, imports, industry, and logistics intersect. That broader view helps separate a high export total from a country’s underlying production profile.
For a quick check, ask what sits behind a ranking:
- Is it measured in current dollars or another value measure?
- Does it count merchandise alone, or services as well?
- Are products grouped as individual goods or broad categories?
- Does the figure include goods that were imported and then re-exported?
These details are not footnotes to the comparison; they can change the answer. A country may lead in a product category by value while another ships more physical volume, and both statements can be correct.
Distinguishing goods from services
Merchandise exports are physical goods sold across borders, such as vehicles, fuel, food, or electronics. Services exports include cross-border services, such as travel, finance, transport, or business services. The two measures are useful, but they describe different kinds of economic activity and should not be treated as interchangeable.
Some broad country rankings combine goods and services into one total, while lists of leading products usually focus on goods. The country export comparison illustrates why it is useful to check whether a table gives total exports or separately identifies top goods. A country can be a major service exporter even when its leading merchandise category is something quite different.
Handling product categories, reporting years, and missing data
Product classifications can be narrow, such as a particular kind of circuit, or broad, such as machinery. The chosen level of detail affects which product appears to be number one. Trade values also change with prices, harvests, production, exchange rates, and demand, so a result from one year should not be presented as a permanent national trait.
Comparable figures can be delayed or incomplete, especially for smaller economies. Some totals include re-exports: goods brought into a country and then shipped onward, which can make a trading hub’s exports look large relative to its domestic production. Country Brief’s Country Explained format puts country comparisons into a wider national context, while exports in current US dollars provides a useful reminder to check the data measure and source before comparing figures.
Biggest exports across Africa
Africa’s export mix reflects varied resources, climates, industries, and access to ports and trade routes. Energy and minerals are prominent in many national accounts, while agricultural goods and manufactured products lead in others. Product rankings can shift from year to year, so the examples here describe recurring export strengths rather than a single synchronized ranking. Country Brief covers economic connections as part of its wider international affairs coverage, including how trade links countries to global markets.
North Africa’s energy, minerals, and agricultural exports
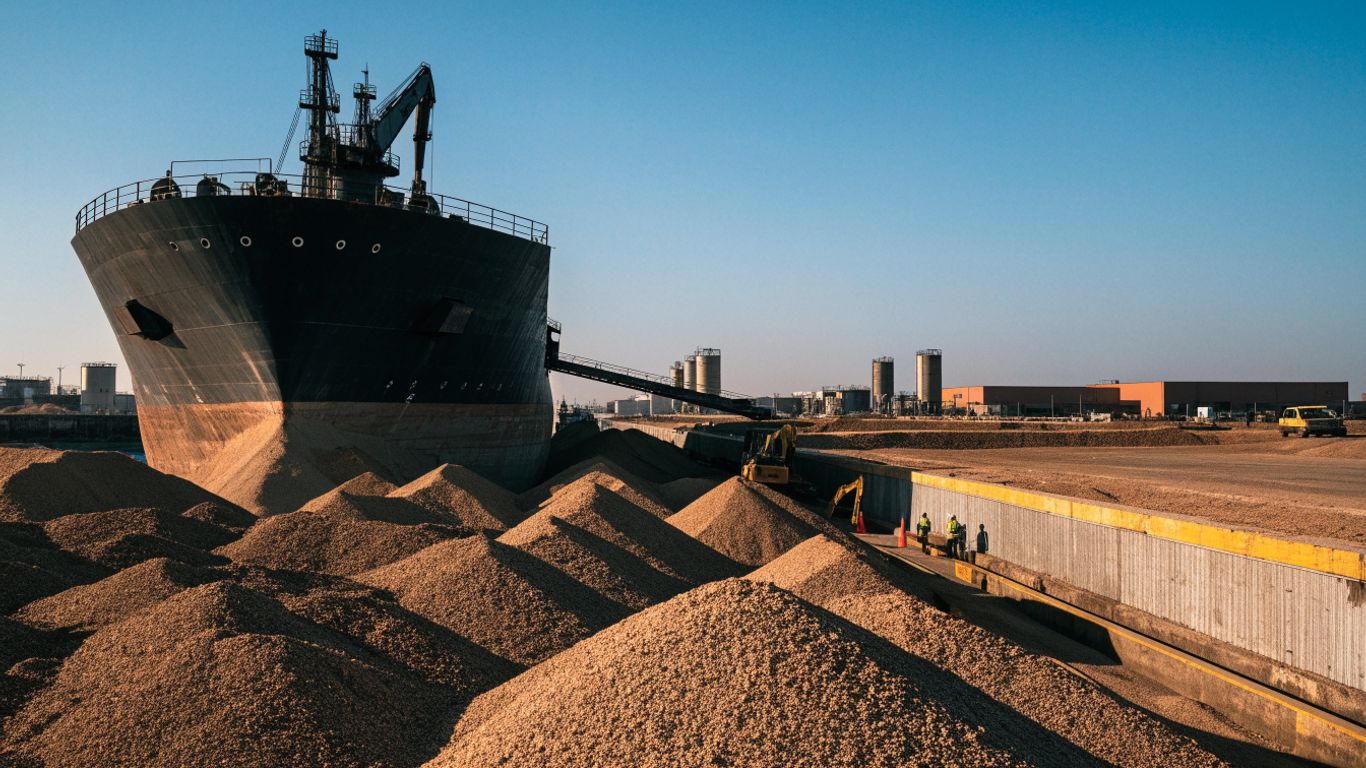
Oil and natural gas are central to the export profiles of several North African countries, particularly Algeria and Libya. Morocco is known for phosphate exports and also sells manufactured products, while agricultural exports across the region include goods such as citrus and dates. The balance differs country by country: a resource-rich economy may rely heavily on energy, while another has a more varied export base.
A few examples show why it helps to name the country as well as the product. These are recurring leading export categories, not a claim that each product ranks first in every recent reporting year.
| Country | Leading export examples | Why comparisons need care |
|---|---|---|
| Algeria | Natural gas and petroleum | Energy prices affect export value |
| Morocco | Phosphates and manufactured goods | Product rankings vary by category |
| Egypt | Petroleum products and agricultural goods | Broad groups can change the result |
| Libya | Crude petroleum | Production and prices can shift totals |
The table offers a regional snapshot, not a uniform league table. In particular, a broad category such as petroleum products can combine goods that a more detailed classification would list separately.
West and Central Africa’s leading commodities and manufactured goods
West Africa’s exports include crude oil, gold, cocoa, and other agricultural commodities. Nigeria is associated with petroleum exports; Ghana exports gold and cocoa; and Côte d’Ivoire is a major cocoa origin. Across Central Africa, minerals, oil, and timber are important in several economies, with copper and cobalt prominent in the Democratic Republic of the Congo.
These patterns connect global demand to local livelihoods and public revenue, but they do not mean that every country relies on the same commodity. Some economies also export processed foods, chemicals, and other manufactured goods. A single leading product can dominate a list while leaving much of a country’s productive activity out of view.
East and Southern Africa’s top exports by country
East African export profiles include agricultural goods such as tea, coffee, and cut flowers, alongside minerals and manufactured products. Kenya is associated with tea and horticultural exports, while Ethiopia is known for coffee. In Southern Africa, South Africa has a diversified mix that includes minerals, vehicles, and agricultural goods; Botswana is strongly associated with diamonds, and Zambia with copper.
The region makes clear why a “biggest export” should not be confused with the whole economy. A mineral may lead export receipts in one country, while a neighboring state earns more from farm products or industrial goods. The category and year used can change the precise ordering.
Biggest exports across the Americas
The Americas span major energy producers, industrial exporters, agricultural powerhouses, and smaller economies with concentrated export sectors. North American supply chains link raw materials, components, and finished products across borders, while South America combines minerals, fuels, and food exports. Across Central America and the Caribbean, a smaller number of product lines can account for a substantial share of trade. Country Brief’s Country Explained format is designed to make such country-level contrasts easier to place in context.
North America’s energy, vehicles, and agricultural products
The United States exports a broad range of goods, including petroleum, aircraft, machinery, agricultural products, and vehicles. Canada is a major exporter of petroleum and also sells vehicles, minerals, forest products, and farm goods. Mexico’s exports include cars and automotive parts, electronics, machinery, and agricultural products, with production closely connected to North American manufacturing networks.
The leading category depends on how goods are grouped and the year being compared. A vehicle assembled in one country may use components made in another, so the final export value does not describe the entire cross-border production process. Export totals are best read alongside the supply chains that support them.
Central America and the Caribbean’s leading exports
Central American exports include coffee, bananas, sugar, seafood, and manufactured goods such as apparel and medical devices, with different products prominent in different countries. In the Caribbean, energy products matter in some economies, while others export minerals, agricultural goods, or seafood. Tourism and other services can be economically important, but they belong in a services measure rather than a list of merchandise exports.
Smaller economies may have a concentrated export base, which makes annual values sensitive to prices, weather, and production changes. A leading item can also be a manufactured product rather than a traditional crop, so assumptions based on geography alone can miss important shifts.
South America’s minerals, fuels, and farm products
South America is a major source of agricultural commodities, minerals, and energy. Brazil exports goods including soybeans, iron ore, and crude oil; Chile is strongly associated with copper; and Peru exports copper and other minerals. Argentina’s export mix includes farm products, while oil and gas have become increasingly important to its trade profile.
These categories connect the region to global demand for food, metals, and fuel. Their relative importance can change quickly when commodity prices move, even if the physical amount shipped changes little. For that reason, a current-dollar ranking is a snapshot of both production and market conditions.
Biggest exports across Asia
Asia contains some of the world’s largest manufacturing economies as well as major exporters of energy, minerals, agricultural products, and services. Electronics and machinery are central to several East Asian export profiles, while South and Southeast Asia combine factory production with farm goods and service exports. Central and West Asian economies include major energy and mineral suppliers. Country Brief’s international analysis connects these trade patterns to the relationships and industries that cross national borders.
East Asia’s electronics, vehicles, and machinery
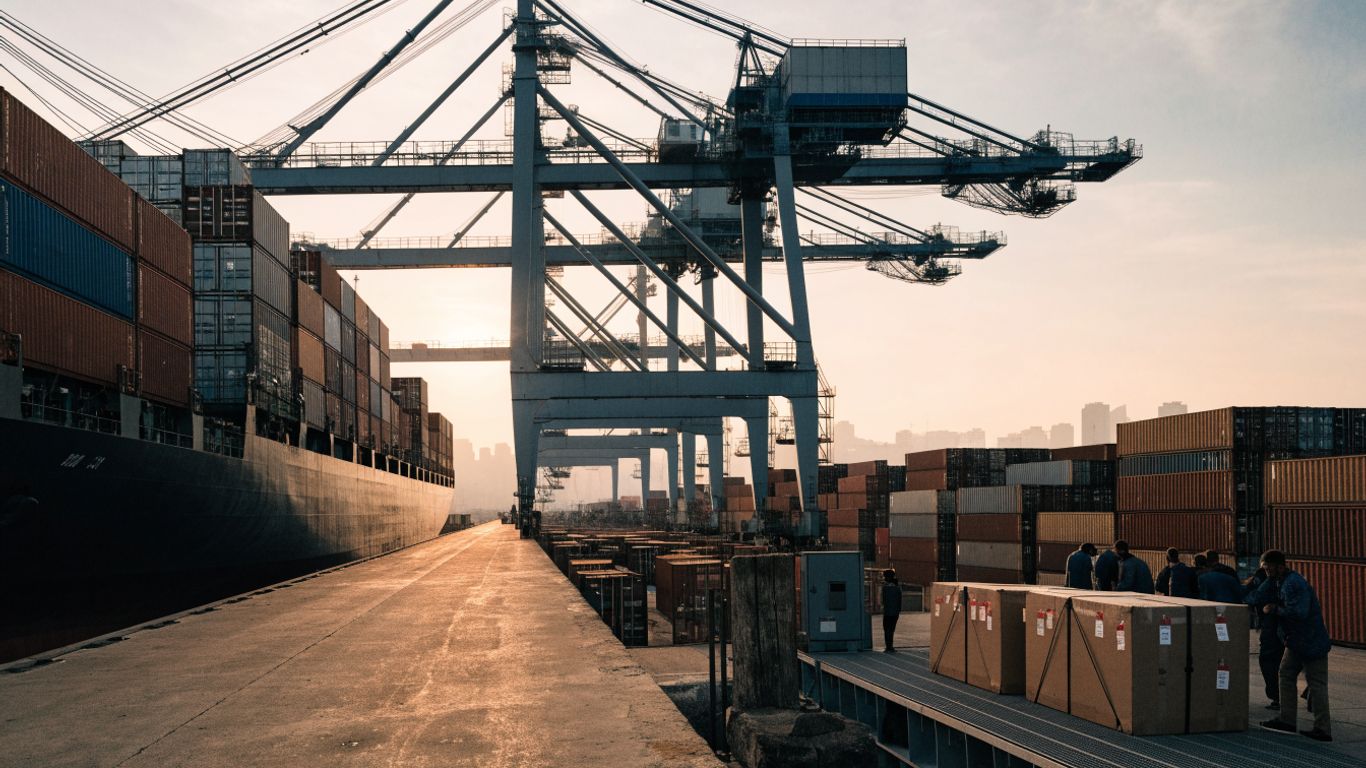
China exports a broad range of manufactured products, including electronics, machinery, and vehicles. Japan is strongly associated with cars and industrial machinery, while South Korea exports products including integrated circuits, vehicles, and ships. Taiwan is particularly known for electronics and semiconductors, though precise rankings depend on the product classification and reporting year.
The region’s manufacturing strength rests on complex supply chains, not just final assembly. A finished product may incorporate parts and materials from several economies before it is shipped to its buyer. National export rankings capture the recorded cross-border sale, but not every step of production behind it.
South and Southeast Asia’s leading goods and services
India exports refined petroleum products, medicines, engineering goods, and agricultural products, alongside a substantial range of services. Bangladesh is widely associated with apparel exports, while Vietnam exports electronics, garments, footwear, and other manufactured goods. Southeast Asian export profiles also include integrated circuits in Malaysia and Singapore, and coal and other commodities in Indonesia.
Services should be kept separate when comparing top goods. Software, business services, and travel can contribute to a country’s total exports without appearing in a merchandise product ranking. The distinction matters especially for economies whose international earnings span both factories and service industries.
Central and West Asia’s energy and mineral exports
Oil and natural gas are prominent exports for several countries in West Asia, including Saudi Arabia, Qatar, and the United Arab Emirates. Mineral and energy exports also matter across Central Asia, where national profiles can include oil, gas, gold, and other metals. The exact leading product varies with each country’s resource base and the year’s global prices.
These exports shape trade relationships well beyond the region, supplying energy and industrial inputs to distant markets. Yet a headline commodity does not capture the full economy: services, manufacturing, and domestic production may be significant even when they are less visible in a goods ranking.
Biggest exports across Europe
Europe’s exports combine advanced manufacturing, pharmaceuticals, food and drink, energy, and high-value industrial goods. Some countries are deeply integrated into regional production networks, so components may cross borders more than once before a finished product reaches its destination. Re-exports can also be significant for trading hubs. The European electricity trade overview offers one example of how cross-border exchange links national economies, though electricity is only one part of the region’s trade picture.
Northern and Western Europe’s leading manufactured goods
Germany is strongly associated with vehicles, machinery, and chemicals, while the Netherlands exports a wide range of manufactured and agricultural goods and functions as a major trading hub. France exports aircraft, medicines, vehicles, and food products; the United Kingdom’s goods profile includes machinery, vehicles, medicines, and precious metals. Norway stands out for petroleum and natural gas, as well as seafood.
A country’s recorded exports do not always equal goods produced entirely within its borders. Re-exports and regional distribution can raise trade totals, particularly in economies that serve as logistics hubs. This is one reason to distinguish a country’s export value from the domestic origin of every item in that total.
Southern Europe’s food, vehicles, and industrial exports
Italy exports machinery, vehicles, medicines, and food products, including processed foods. Spain’s goods exports include vehicles, machinery, and agricultural products, while Greece exports refined petroleum, food, and other manufactured goods. Across the region, industrial production sits alongside strong agricultural and food-processing sectors.
The product that ranks first may depend on whether a data source separates or combines categories. A broad category can elevate machinery or medicines, while a narrower list may give a different picture. The country’s export mix is therefore more revealing than any single item in isolation.
Central and Eastern Europe’s top exports by country
Central and Eastern European economies are closely connected to European manufacturing supply chains. Poland exports machinery, vehicles, food, and manufactured components; Czechia and Slovakia are known for vehicles and automotive parts; and Hungary exports vehicles, electronics, and machinery. Romania’s export mix includes vehicles, machinery, and electrical equipment.
These examples show how industrial specialization can differ even among neighboring countries. Components and finished goods move across borders, so a country’s strongest export category may reflect participation in a wider production network rather than a fully domestic supply chain.
Biggest exports across Oceania
Oceania’s export patterns range from Australia’s large mineral and energy shipments to the smaller, more concentrated trade bases of Pacific island states. New Zealand combines agricultural exports with manufactured products and services. For many island economies, distance, limited production scale, and reliance on a small number of sectors shape what can be sold abroad. The result is a region where simple comparisons need careful attention to both goods and services.
Australia and New Zealand’s leading exports
Australia exports iron ore, coal, natural gas, and agricultural products, with the leading category changing according to prices and the year measured. New Zealand’s exports include dairy, meat, forestry products, and other agricultural goods. Both countries also export services, but those earnings should be assessed separately from merchandise rankings.
The contrast is a useful reminder that neighboring countries can have very different export profiles. Resource extraction shapes Australia’s goods trade, while New Zealand’s export identity is closely linked to agriculture and food production, alongside other sectors.
Melanesia’s minerals, energy, and agricultural products
Melanesian export profiles include minerals and energy as well as agricultural and forest products. Papua New Guinea exports goods such as liquefied natural gas, gold, copper, and agricultural commodities. Fiji’s exports include sugar, fish, and other goods, while Solomon Islands exports include timber and fish products.
The mix varies significantly between countries, and a small number of large shipments can carry considerable weight in annual totals. That concentration means rankings can shift when production, transport, or global prices change.
Micronesia and Polynesia’s top exports and export limitations
Many Micronesian and Polynesian economies have small domestic markets and limited industrial capacity, which can narrow the range of goods they export. Fisheries, agricultural products, and niche goods feature in some national trade profiles, while tourism and other services can be more prominent in broader export accounts. A goods-only ranking therefore offers an incomplete view of how these economies earn income from abroad.
Distance from large markets and vulnerability to disruptions can add to the challenge of exporting at scale. These constraints do not make the economies interchangeable: each has its own resources, trading relationships, and policy choices. They do make it especially important to check whether a comparison includes services and which years have available data.
Conclusion
There is no single permanent answer to which product is the biggest export of every country. The result depends on the reporting year, the definition of a product category, and whether the comparison counts goods alone or services as well. Read as a set of country-specific snapshots, export rankings reveal how resources, industries, and regional supply chains connect economies—while their limits are a reminder to look beyond the top line.
Frequently Asked Questions
What does “biggest export” mean?
It usually means the product or product category with the highest export value in a specified period. Some rankings instead compare physical volume or combine goods and services, so the measure should be checked.
Does the biggest export always mean the most exported by weight?
No. A high-priced product may lead in export value even if a country ships a greater physical volume of another good. Value and volume answer different questions.
Are services included in a country’s biggest export?
They can be, if the ranking combines goods and services. A list of top products usually focuses on merchandise, while services such as tourism or finance are reported separately.
Why can a country’s leading export change from year to year?
Prices, harvests, production levels, exchange rates, and demand can all alter the value of exports. Changes in how products are grouped can also affect which category ranks first.
What is a re-export?
A re-export is a good imported into a country and then shipped onward to another market. Re-exports can raise recorded export totals without meaning that all the goods were produced domestically.
Why do different sources list different top exports for the same country?
Sources may use different years, reporting methods, product classifications, or definitions of exports. One source may also combine goods and services while another reports merchandise alone.
Are export rankings a full measure of a country’s economy?
No. They show one part of economic activity and can highlight a country’s links to global markets, but they do not describe domestic production, employment, income distribution, or the full role of services.